Screenshots, charts, better AI and 3 new locations
This month, we have a couple of new features to show you. It's not much, as we're working hard on the most significant update of Spectate yet.
We have been hard at work on migrating Spectate to ClickhouseDB. As a result, queries are incredibly fast, and all reports are now real-time, including uptime percentages. We don't cache (yet), as the performance has been rock solid for the last few weeks.
This month's primary focus was preparing for our next update and ensuring Spectate is even faster and more stable. And it worked. Error logging has been quieter than ever before.
The two most significant features we have released are Incident screenshots and charts in notifications.
📸 Screenshots are here!
— Spectate (@spectate_hq) September 25, 2023
Spectate's latest feature automatically captures screenshots when a heartbeat fails, allowing you to see what goes wrong instead of guessing. pic.twitter.com/12drxmq02t
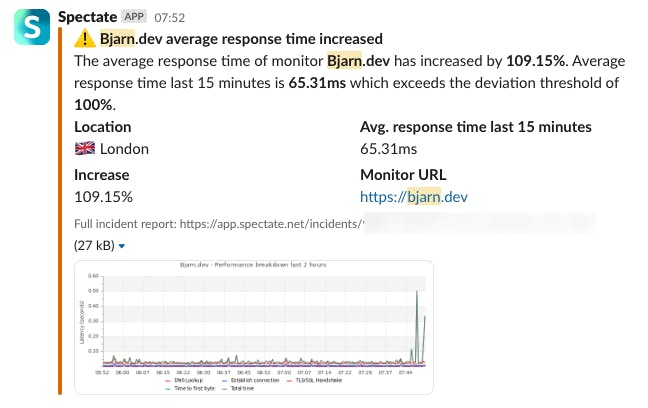
Notifications have been updated to include charts indicating what is going on with performance in the previous period.
What's new?
- Incident screenshots - allowing you to see the error page visually.
- Charts are now included in notifications.
- Added Singapore location.
- Added San Francisco location.
- Added Bangalore location.
- Added setting to change time periods of performance monitoring.
Improvements
- Updated chart to highlight the area of an incident.
- Updated chart to show the line of the hard performance threshold.
- Disabled monitors are now showing as disabled instead of showing their latest uptime status.
- Updated Slack integration.
- Uptime calculation is now real-time instead of updated every 5 minutes.
- Migrated to ClickhouseDB with massive performance improvements as a result.
- Updated notifications in the web application.